This article is also published in Dutch on ddma.nl and Emerce.
In this article from the DDMA Committee on Data, Decisions and Engagement we discuss Customer Journey Mapping as part of Customer Journey Management, the importance of CJA, and the appropriate metrics you can use per journey or journey segment. We have focused specifically on B2C journeys because of the added complexity that CJA brings to B2B journeys.
Customer journeys are more complex than people generally think, CJA provides clarity
Customer Journey Mapping is often the first step in Customer Journey Management. The second step is to organise teams, which then get started on improving journey segments or linking customer journeys. The third step is usually the monitoring of results and improvement actions. It is for this last part that you can deploy Customer Journey Analytics (CJA). This is a term that has seen greater use in recent years and which Forrester defines as:
“An analytics practice that combines quantitative and qualitative data to analyse customer behaviours and motivations across touchpoints and over time. It embraces analytics to gain a deeper understanding of customers’ movement across different phases of the journey”.
Or put more simply: CJA is about clarifying how customers come into contact with an organisation, which channels they use over time and in what context this contact takes place.
Funnily enough, many companies still see ‘the journey’ or the customer journey as a roadmap, a route they can prescribe for consumers and over which they have control.

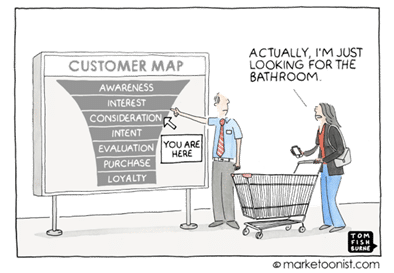
Figure: a funnel does not reflect the reality of a customer journey
The funnel, as illustrated above, is often used as a guideline for the journey. Consumers are at the top of the funnel for a particular product and need to be influenced to convert when they reach the bottom. The assumption is that the journey is linear. Unfortunately, this is not the case. For some time, it’s been the customers themselves who are in control of the customer journey. They decide when they make contact with a company, through which channel and about what. What’s more, this varies for different products and services. As such, there are many more journeys!
In addition, the order in which customers take certain steps is not as neatly structured as companies conceptualise it. And that is what makes CJA so interesting; it collects data from all corners of the organisation and tries to identify how the customer moves between the touchpoints. How, for example, does a customer jump from complaining to the call centre to making a purchase using the app to finally notifying the organisation of a change of address on its website? This provides some interesting insights.
The idea of monitoring and analysing interactions in customer journeys arose a few years ago, with one of the main questions being: How can channels work together to organise the optimal customer journey? This process of Customer Journey Mapping has helped companies to use a more omnichannel approach and operate a more customer-oriented strategy. Marketing and MarTech specialists have also started to collaborate more to reveal insights and understand each other better.
The movement of CJA fits in well with Journey Mapping. We have listed the differences between the two in the table below.
| Customer Journey Mapping | Customer Journey Analytics |
| CJM is an illustration of the customer journey (desired or otherwise) | CJA shows ‘hard’ data of up to millions of interactions |
| Often a simplified representation of the most important journeys | Provides insight into many journeys/journey segments and identifies the most important ones |
| Working out all different journey segments takes a lot of time | Tools help you zoom from macro journeys to journey segments and provide greater insight into behaviour |
| It is a static representation of a certain moment | It gives you real-time insights |
| It is the starting point for many companies. It uses an attractive visual representation to help introduce many departments within a company to customer journeys and illustrate what contribution each one can make to them. | Few companies currently use it because it often requires tooling and expertise to display and interpret the correct data. |
Differences between Customer Journey Mapping and Customer Journey Analytics. Source: Mycustomer

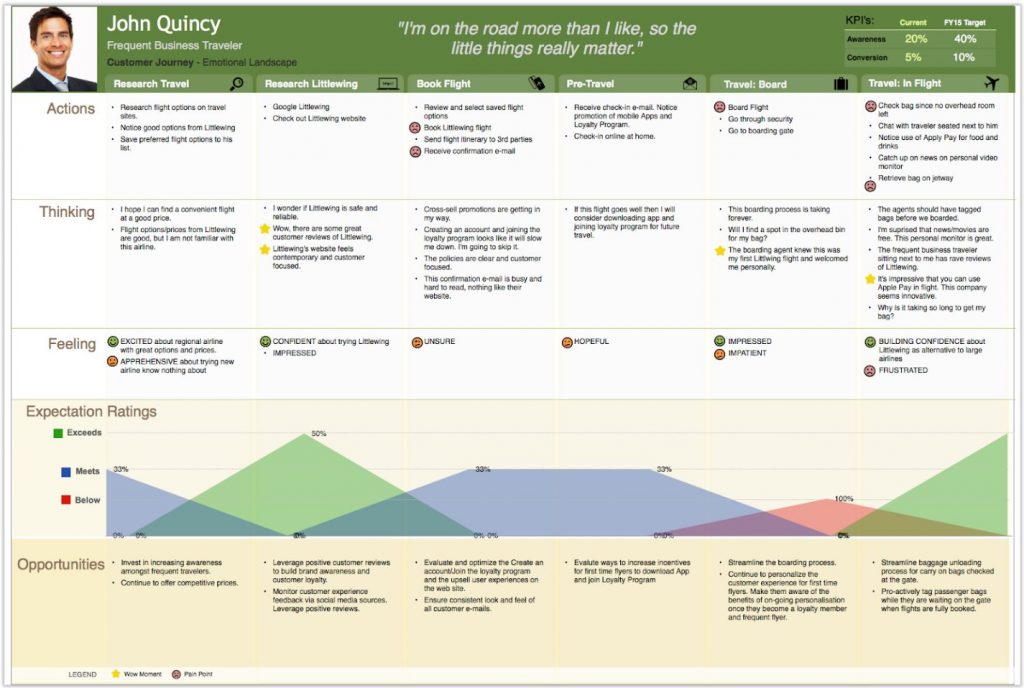
Example of Customer Journey Mapping

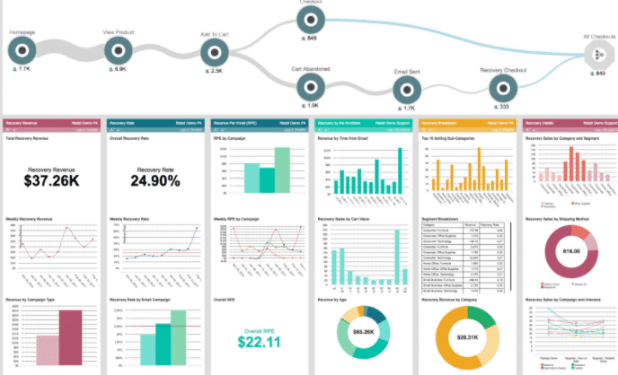
Example of Customer Journey Analytics
Why is CJA important for achieving your business goals?
Using Customer Journey Analytics in addition to Customer Journey Mapping gives you a more detailed qualitative and quantitative impression of your customer interactions across the channels. And that provides a very focused starting point for improving your customer experience.
What do we actually want from CJA, and what good will it do us? According to Treacy & Wiersema’s old but powerful model, if a company is to achieve success it needs to embrace one of the following disciplines: Product Leadership, Operational Excellence and Customer Intimacy. In recent decades, we have seen that the latter discipline has become increasingly important. because it is becoming ever easier to copy products and operations, so the distinction lies in the customer experience. It is not just about creating a single consistent experience across different touchpoints; it’s about creating a customer journey that depends on the person as well as the situation. Understanding the coherence and context of the interactions is therefore of crucial importance. Concerning the coherence and context of interactions, CJA answers the following questions:
- Where do negative reviews come from?
- Why do customers switch channels and how do they experience that?
- What actions or journeys have brought the customer to this point and can we predict the next action or journey?
- What behaviour does the customer show and what did the business expect the customer to do?
- What are the usual journeys and do we need to change content or the interaction entries based on newly identified journeys?
In our previous series of articles on the Central Customer Image, we talked about the value of recent data and how real-time data indicates customer intent.
Examining both real-time and historical data gives you an overall picture. In addition, Data-Driven Marketing Research shows that more and more companies are growing in terms of being data-driven and placing the customer centre stage. This trend also shows an increase in the use of Customer Journey Analytics because we can draw a link to business goals, such as churn reduction/retention, sales growth, customer lifetime value, customer satisfaction/NPS and customer interactions. You can also use CJA reports to demonstrate the effect of adjustments in the customer journey.
The most commonly used metrics and reports
Each stage in the customer journey has its own metrics, so it is helpful to list them first. It is also important always to keep your primary marketing and/or sales goal in mind. The third step is to take the measurable channels available in each phase. Finally, you categorise the touchpoints within the channels and the journey phase.
Below is an example of identified phases and associated metrics (this does not have to be a linear sequence as each customer follows his/her own journey):
| Phases | Associated metrics |
| Awareness | media reach, impressions (views), people reached, engagement, time spent on a digital channel |
| Consideration | share of voice, display percentage, position (SEO/SEA), CTR, interactions (comments, shares, reviews), conversions/micro conversions, search, purchase intent |
| Purchase | visits, visitors, use of UTM tags, origin of the visit, engagement (visit depth, visit duration, bounces), dropout (shopping cart abandonment), purchase (product selection, answer to service question found) |
| Loyalty | customer satisfaction, NPS, retention, repeat purchases, CLV, active subscribers/customers, reviews and recommendations, subscriptions cancellations, spam notifications |
Most commonly used reports:
- Journey reports; visualisation of touchpoints across multiple channels (provides insight into drop-offs etc.)
- Attribution reports; visualisation of sales broken down into target audience, feature, product and/or journey segment and the possibility of zooming in on successful customer conversions (if a value has also been assigned per feature or micro-conversion, this will help you choose where to invest further)
- Cohort report; visualisation of certain trend lines (e.g. provides insight into behaviour or product use in a certain period)
- Retention reports; visualisation of the periods in which a customer has performed certain actions or is engaged (e.g. insight into the number of days that someone received an email offering a product before they visited the webshop)
- CLV reports; visualisation of the various campaigns per target audience and journey segment with corresponding response to the offer
A very interesting point here is attribution. For many companies, it is impossible to see which channels ultimately contribute towards a conversion. And how annoying is it if an organisation’s online department thinks it has failed to achieve a conversion because a prospect completed a transaction via the call centre? Attribution reports from CJA help companies see the correlation between different interactions and visualise them as a whole. This lets you see the impact of multiple interactions and the results from different departments more clearly. Ultimately, the various departments’ KPIs can be linked, resulting in the breaking open of silos and creating a more customer-driven organisation.

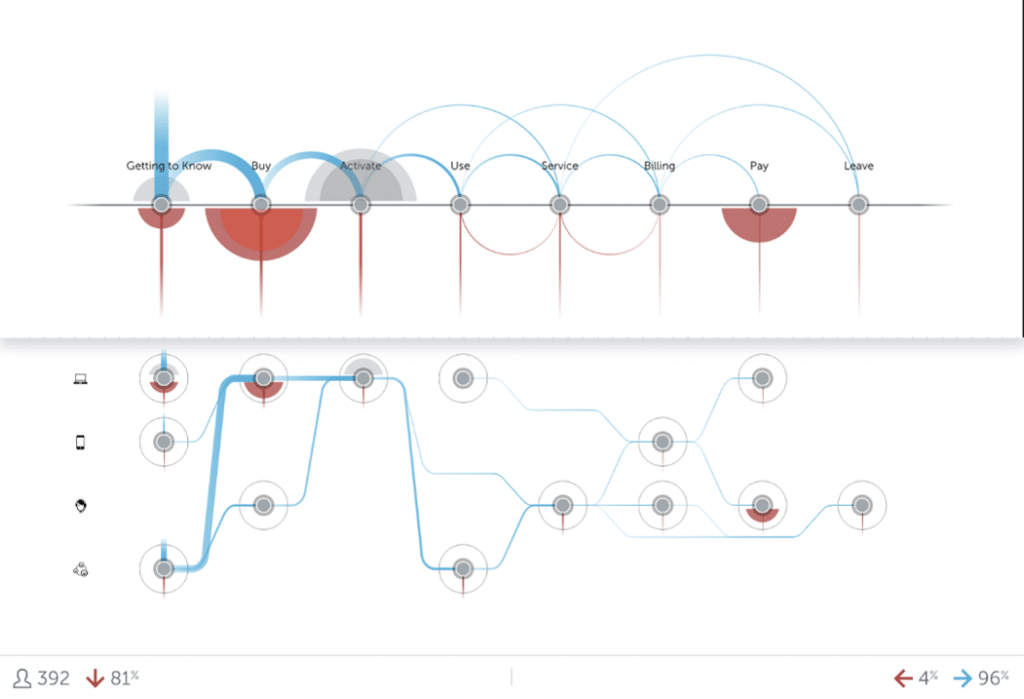
Visualisation of the impact of multiple customer interactions. Source: Thunderhead
The upper part of the above image shows movements in the journey, while the lower part shows the same journey broken down by channel. This provides insight into a number of issues:
- Drop-offs: people who drop out of the journey (meaning their activities stop)
- Journey hoppers: people who move from one journey to another. I am looking for a television and also have a question about when my coffee machine will be delivered.
- Channel hoppers: the use of other channels in the same journey. It is of course possible that there are several days or weeks between visits.
If you include the above metrics in your CJA, you can gain insight into all the channels through which you communicate with customers and vice versa – no matter how complex the customer journey may be. This is because gaining real-time insight into all journeys or journey segments that customers take means you can more quickly recognise opportunities for improving the customer experience and increase conversion rates. CJA is therefore one of the most important parts of Customer Journey Management. In the next and final article in this series, we will therefore look at the biggest challenges people face with CJA and provide some great practical examples of how organisations are tackling them.
Ook interessant

Niet iedereen wil jouw aandacht! Dat biedt kansen voor marketing

Podcast Shaping the Future: AI is geen doel. Data is geen project. Maar samen zijn ze wel urgent


